What information must a recorded match contain to be used to calculate Evals?
Valid date
Starting lineups for both teams
Substitutions (who went out, who came in, and when)
Goals (for which team and when)
Only a fraction of matches are used, because many—typically older or lower-tier ones—lack the required documentation.
Is the Eval system similar to the Elo system used in other games?
Yes, but the Eval formula is specifically tuned for football. It is calculated in two parts:
The percentage of the match a player participated in, which determines their contribution to the result (win, draw, or loss); that outcome is weighted by the average Eval difference between the teams over the entire match.
The goal differential, weighted by the average Eval difference between the teams, that occurred during the period the player was in play. If a player did not play the whole match, that value is then stretched to simulate a full match's performance.
Games that do not have substitutions (chess, tennis, many eSports) would not require the second component for their calculations.
Also, because football matches involve smaller sample sizes, and player physical conditions (especially due to injuries and decline) have a larger impact on performance, the Eval system is arguably more aggressive than conventional Elo systems.
How are match odds determined?
While computing Evals, only matches that satisfy both of these criteria are included in the dataset for determining match odds:
The match occurred within the past decade.
Every participating player had at least 5,000 Total Min prior to the match date.
For each qualifying match, two values are logged:
The difference between the teams’ average Evals (prior to changes from that match).
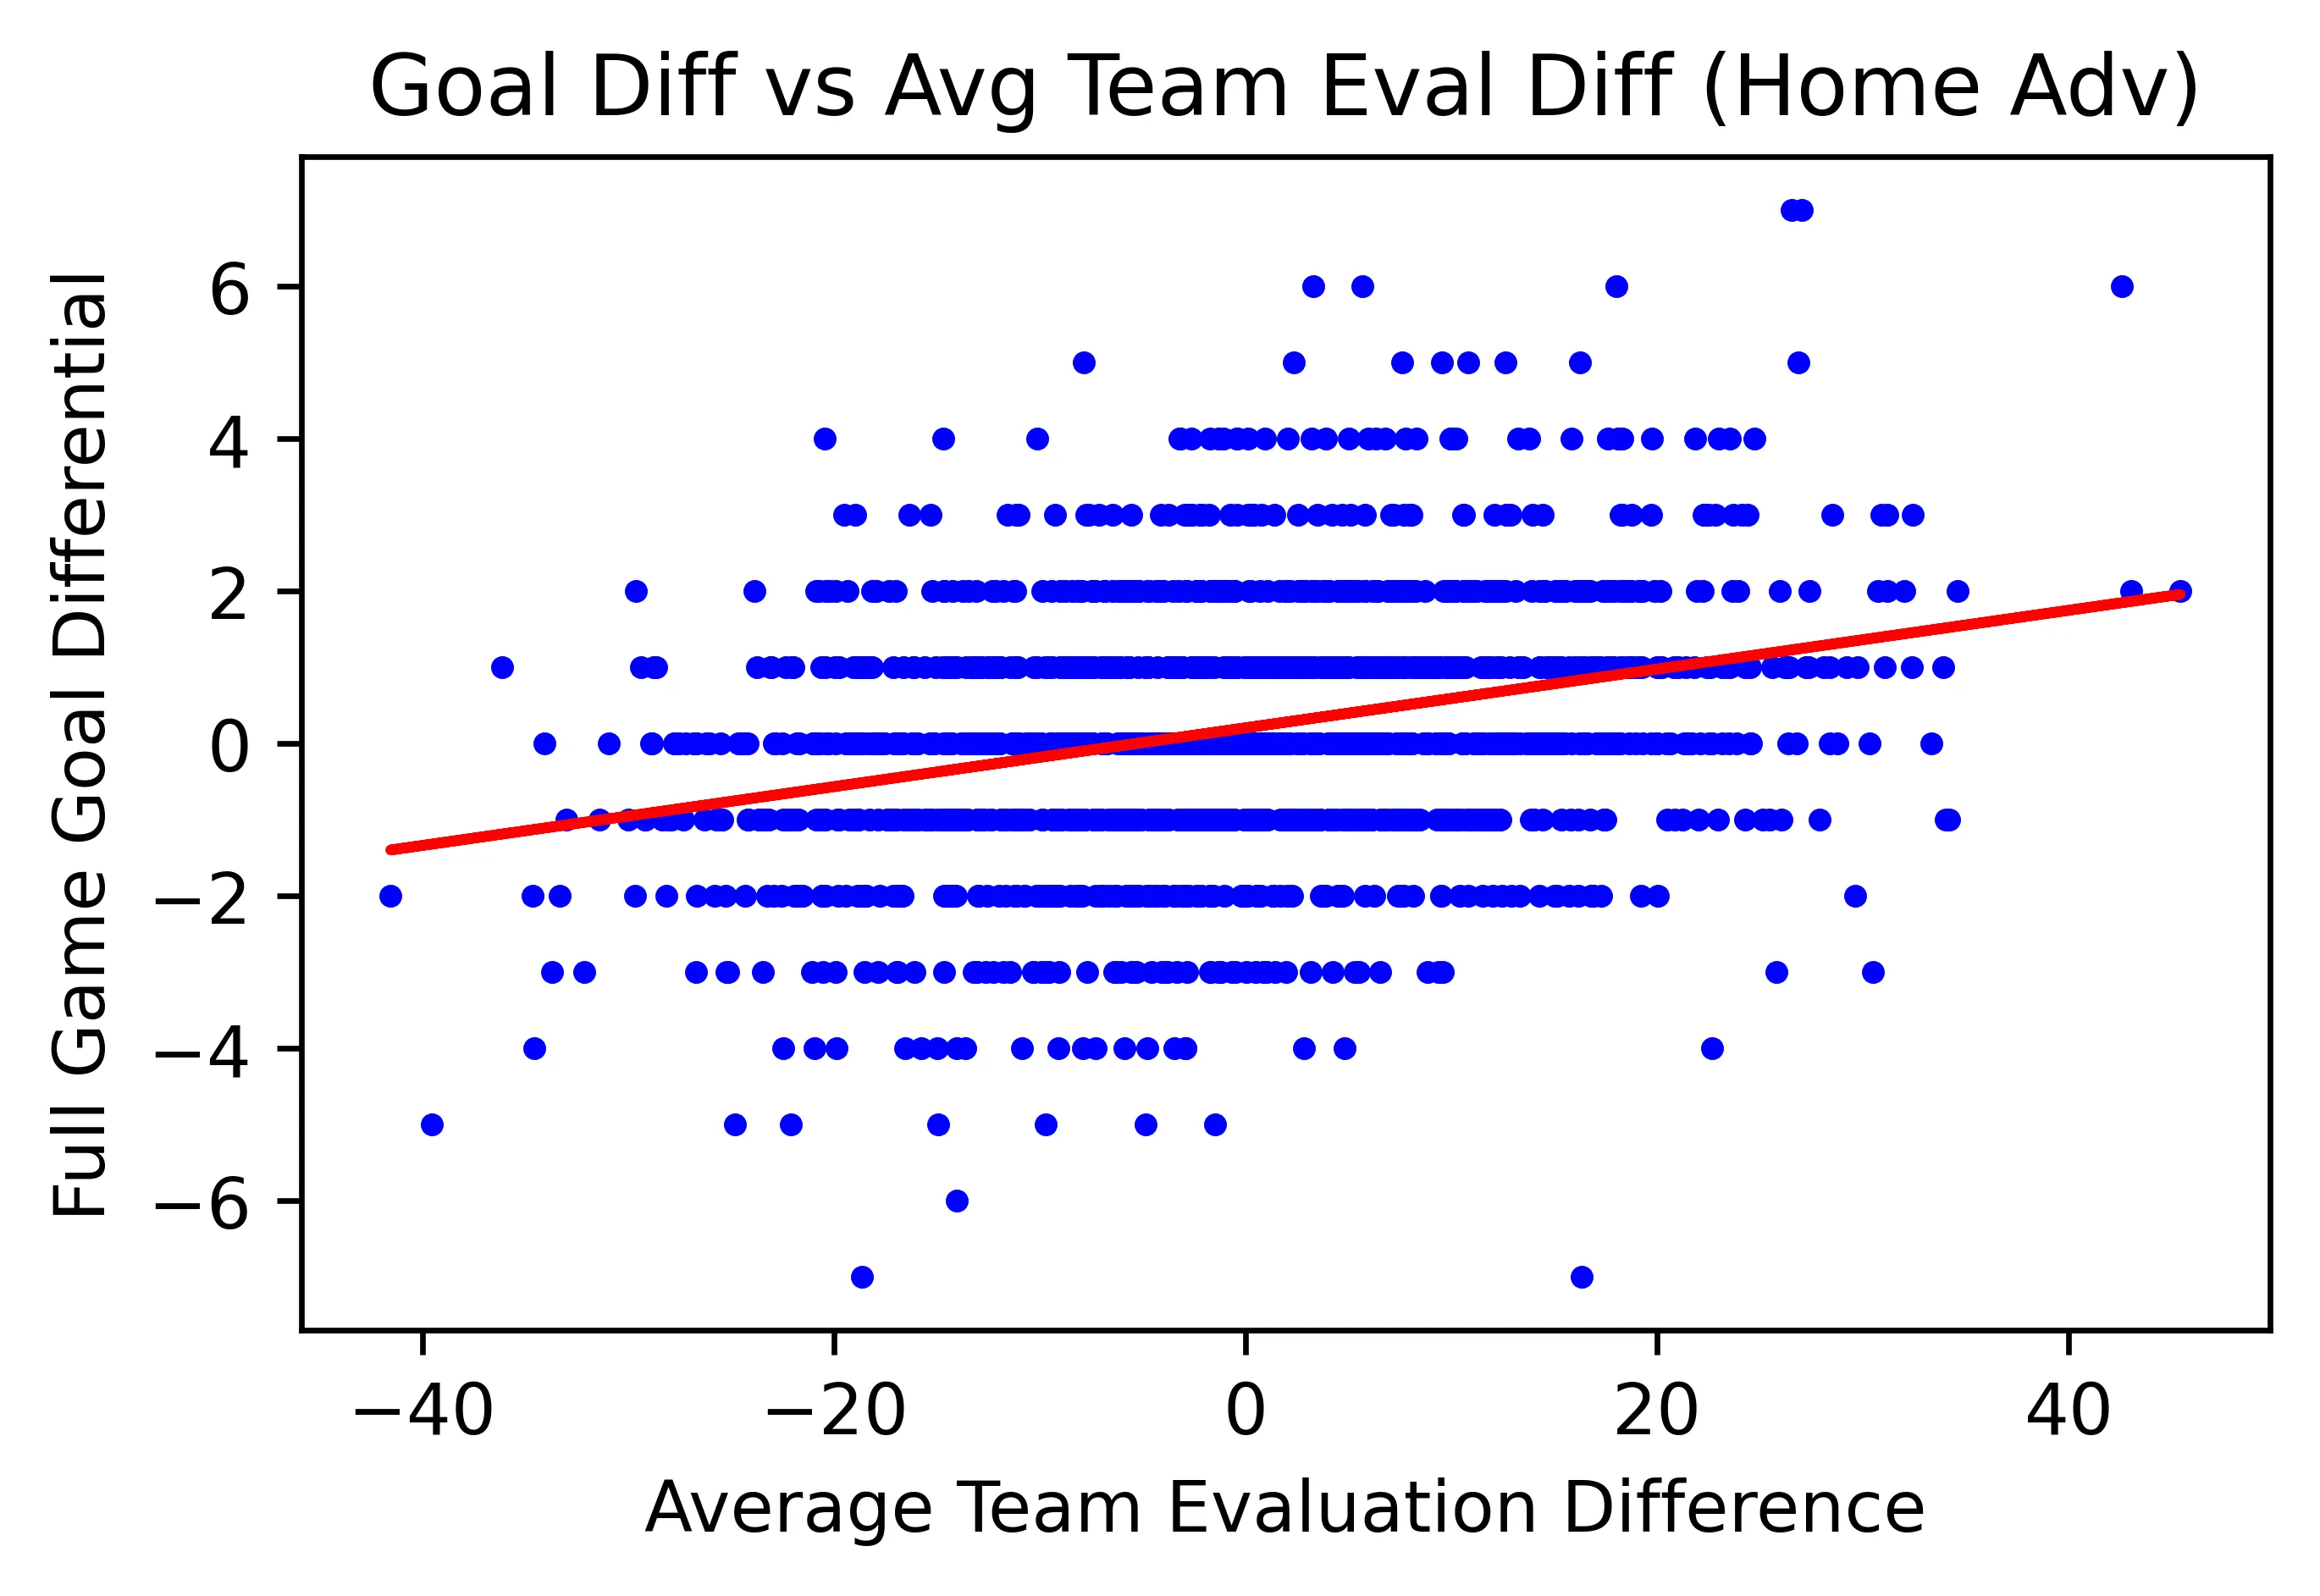
The final goal differential.
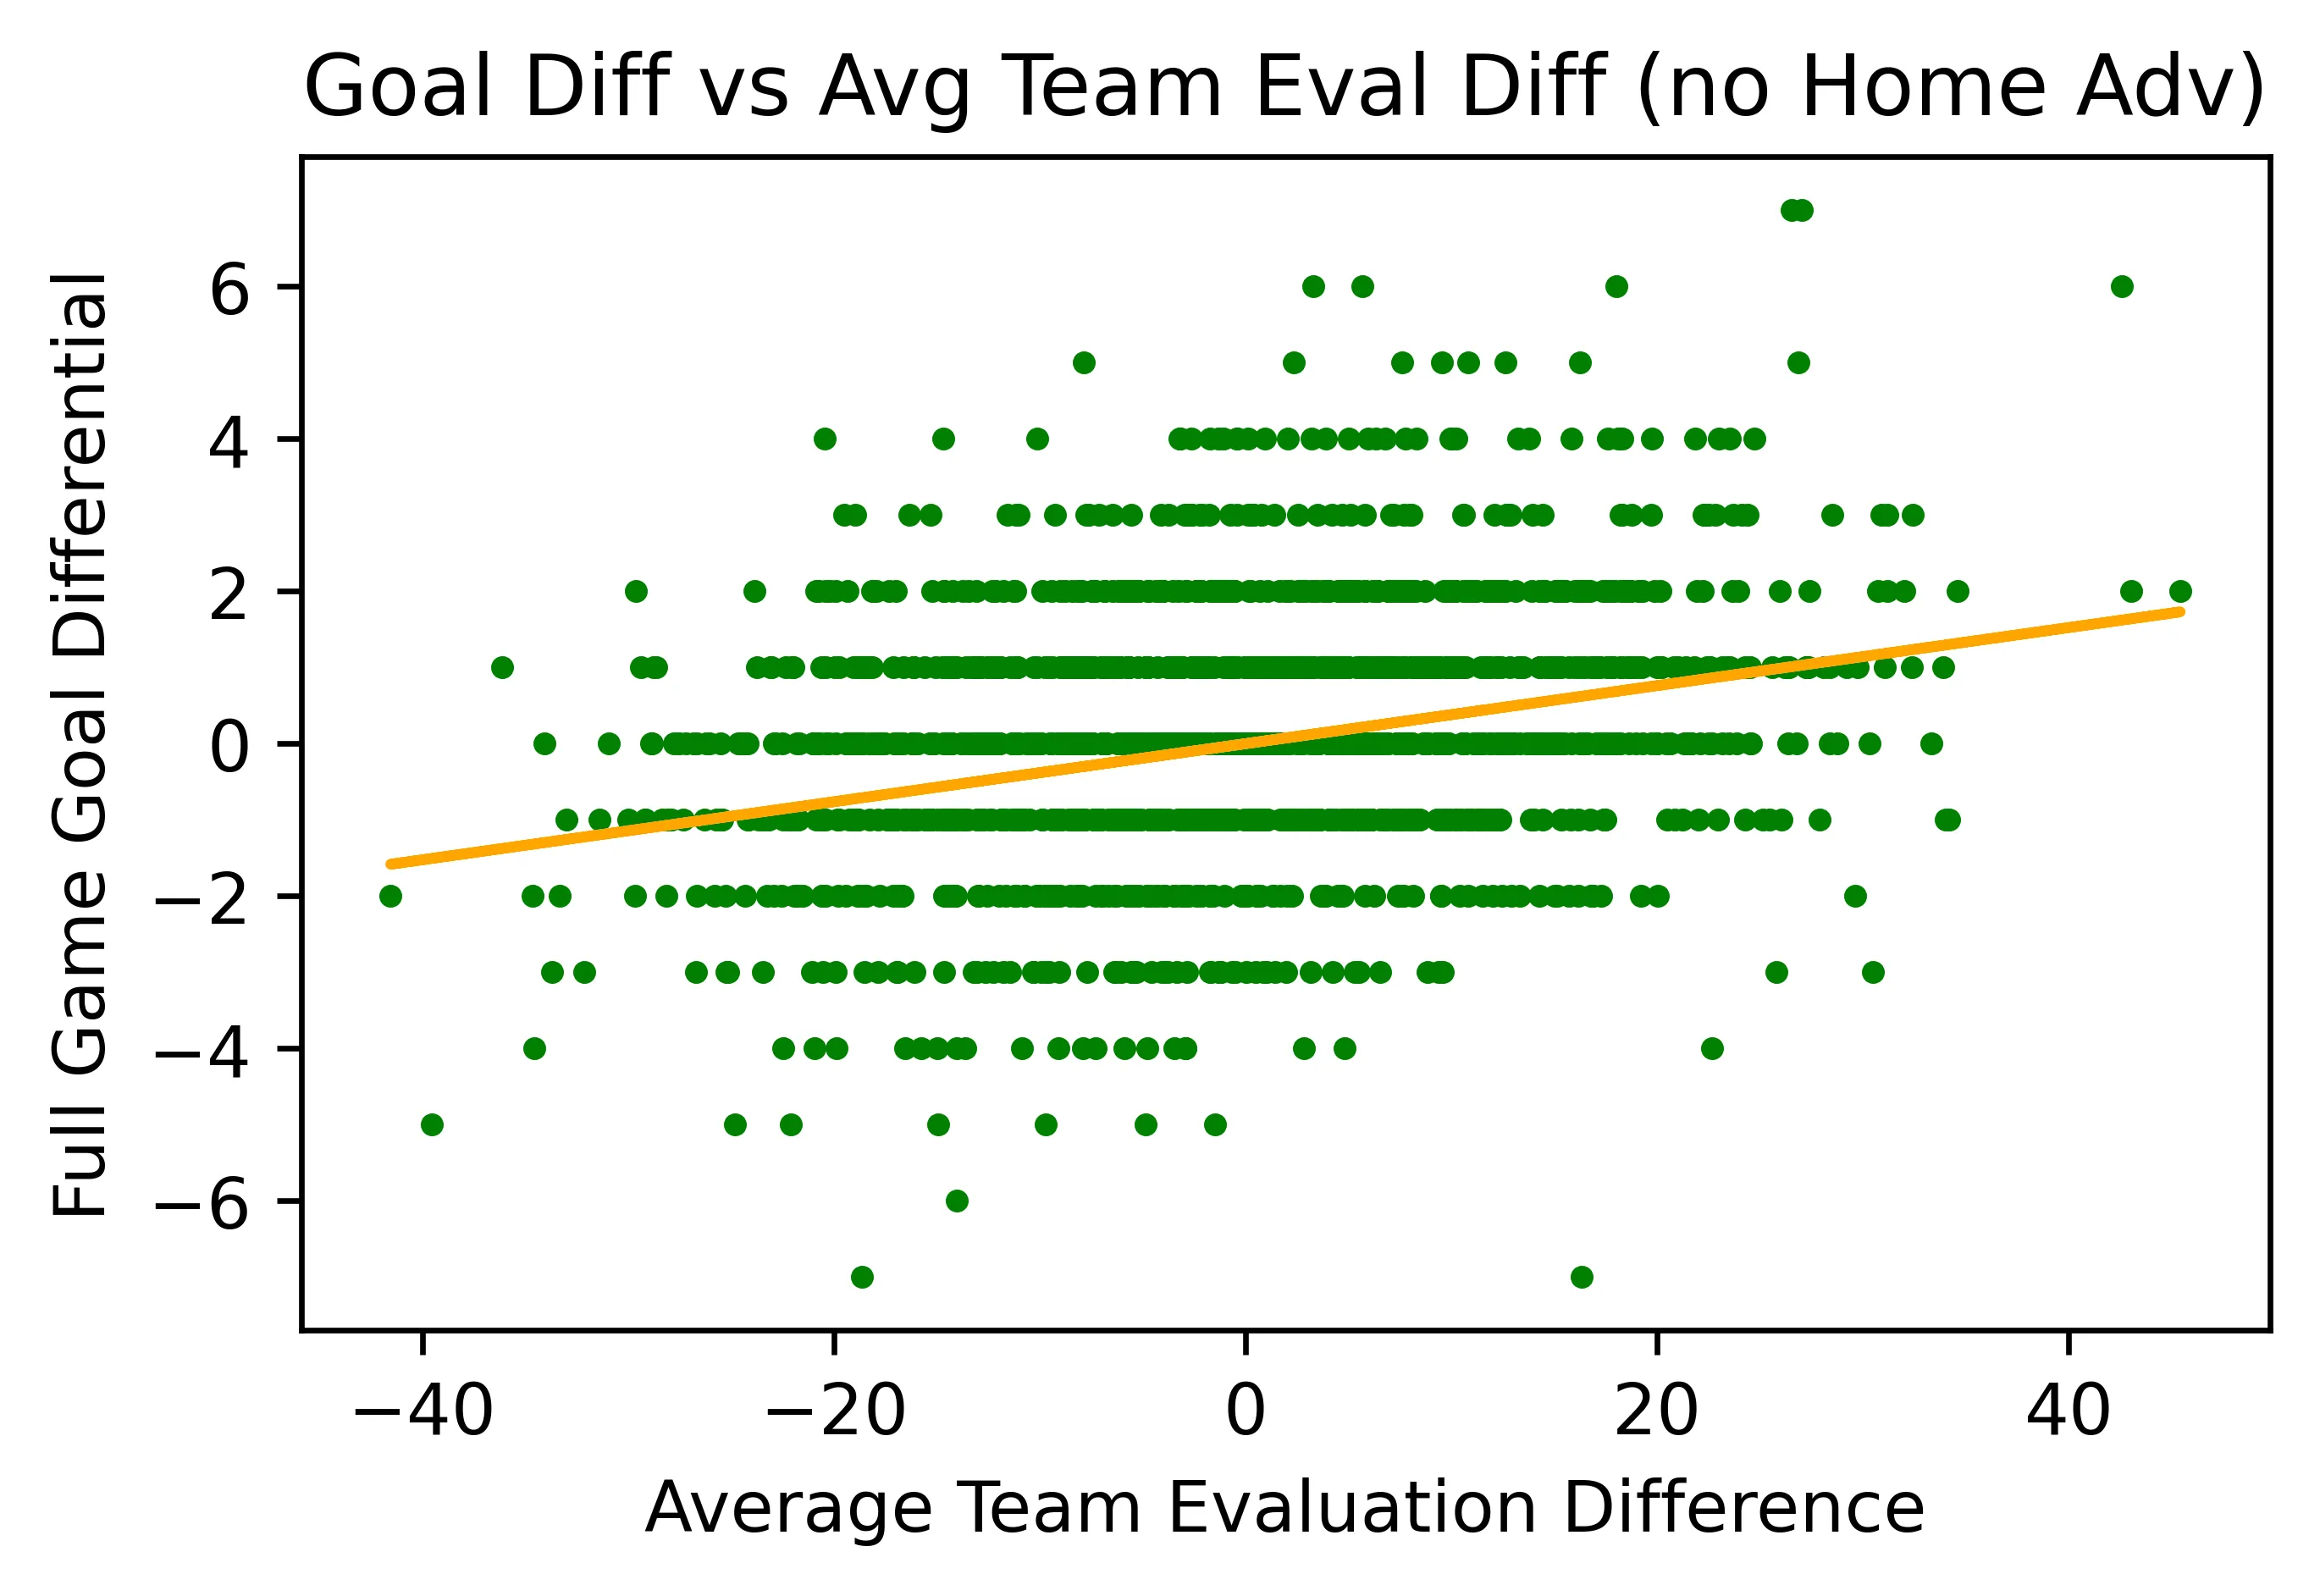
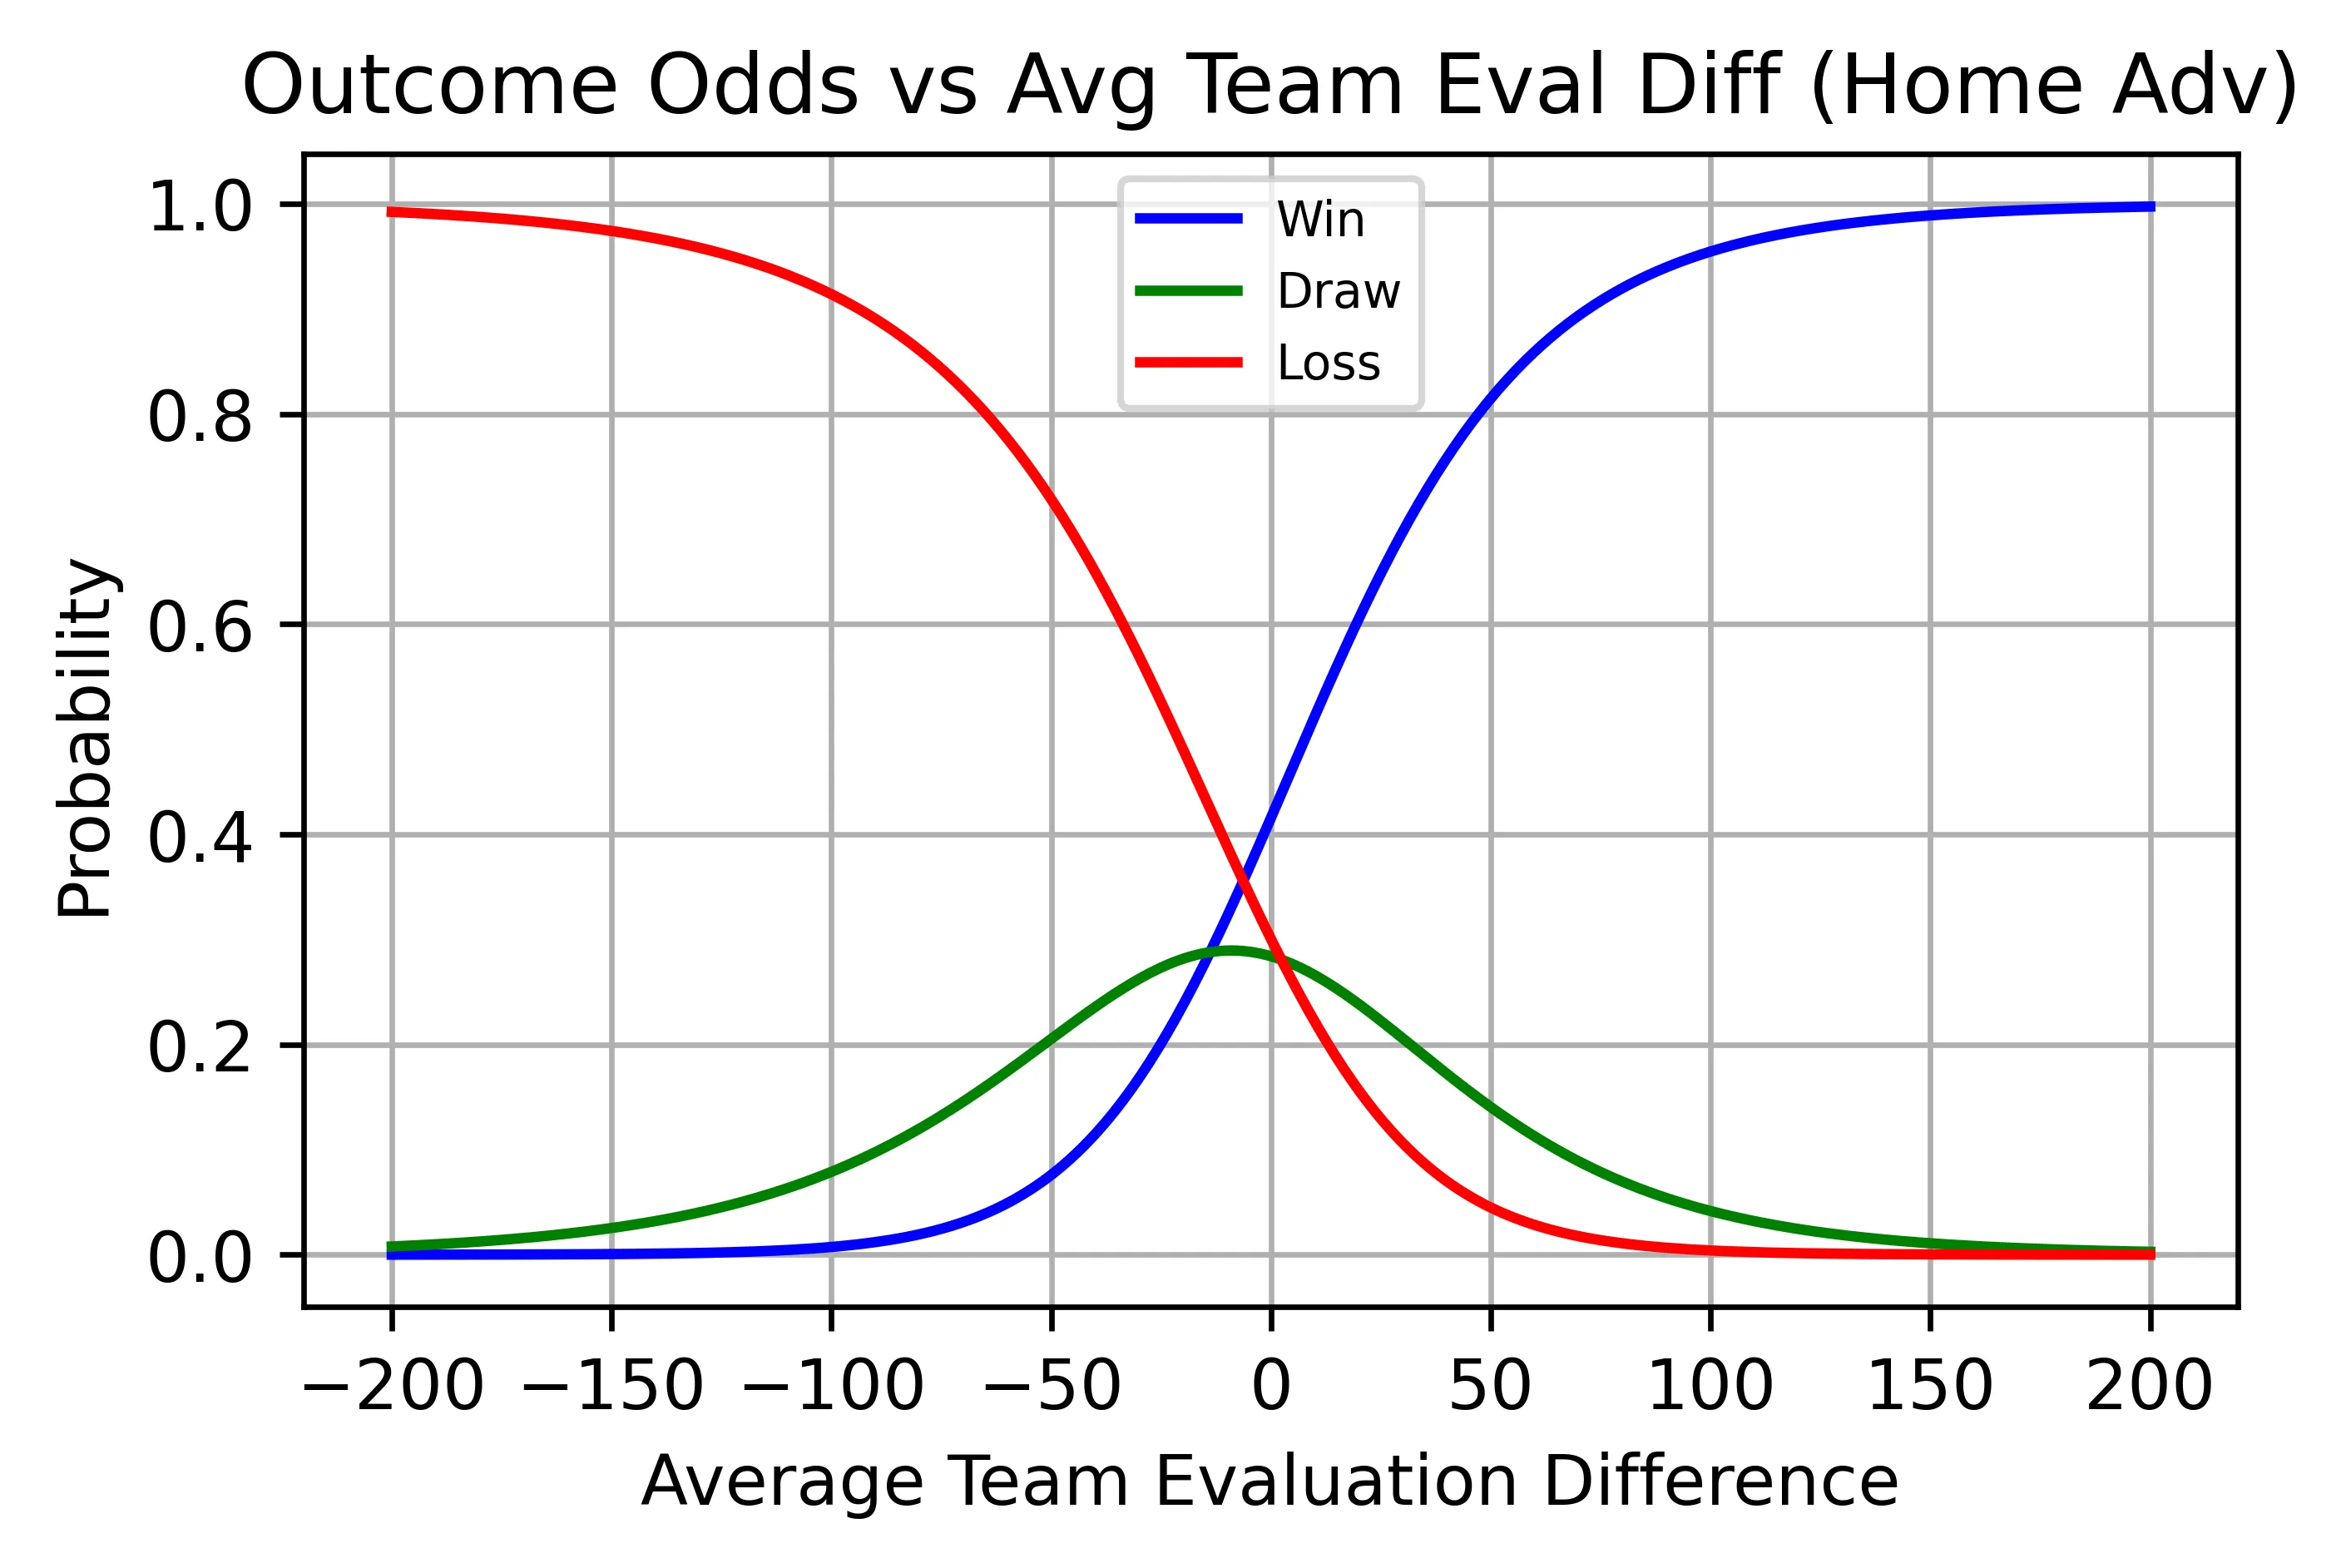
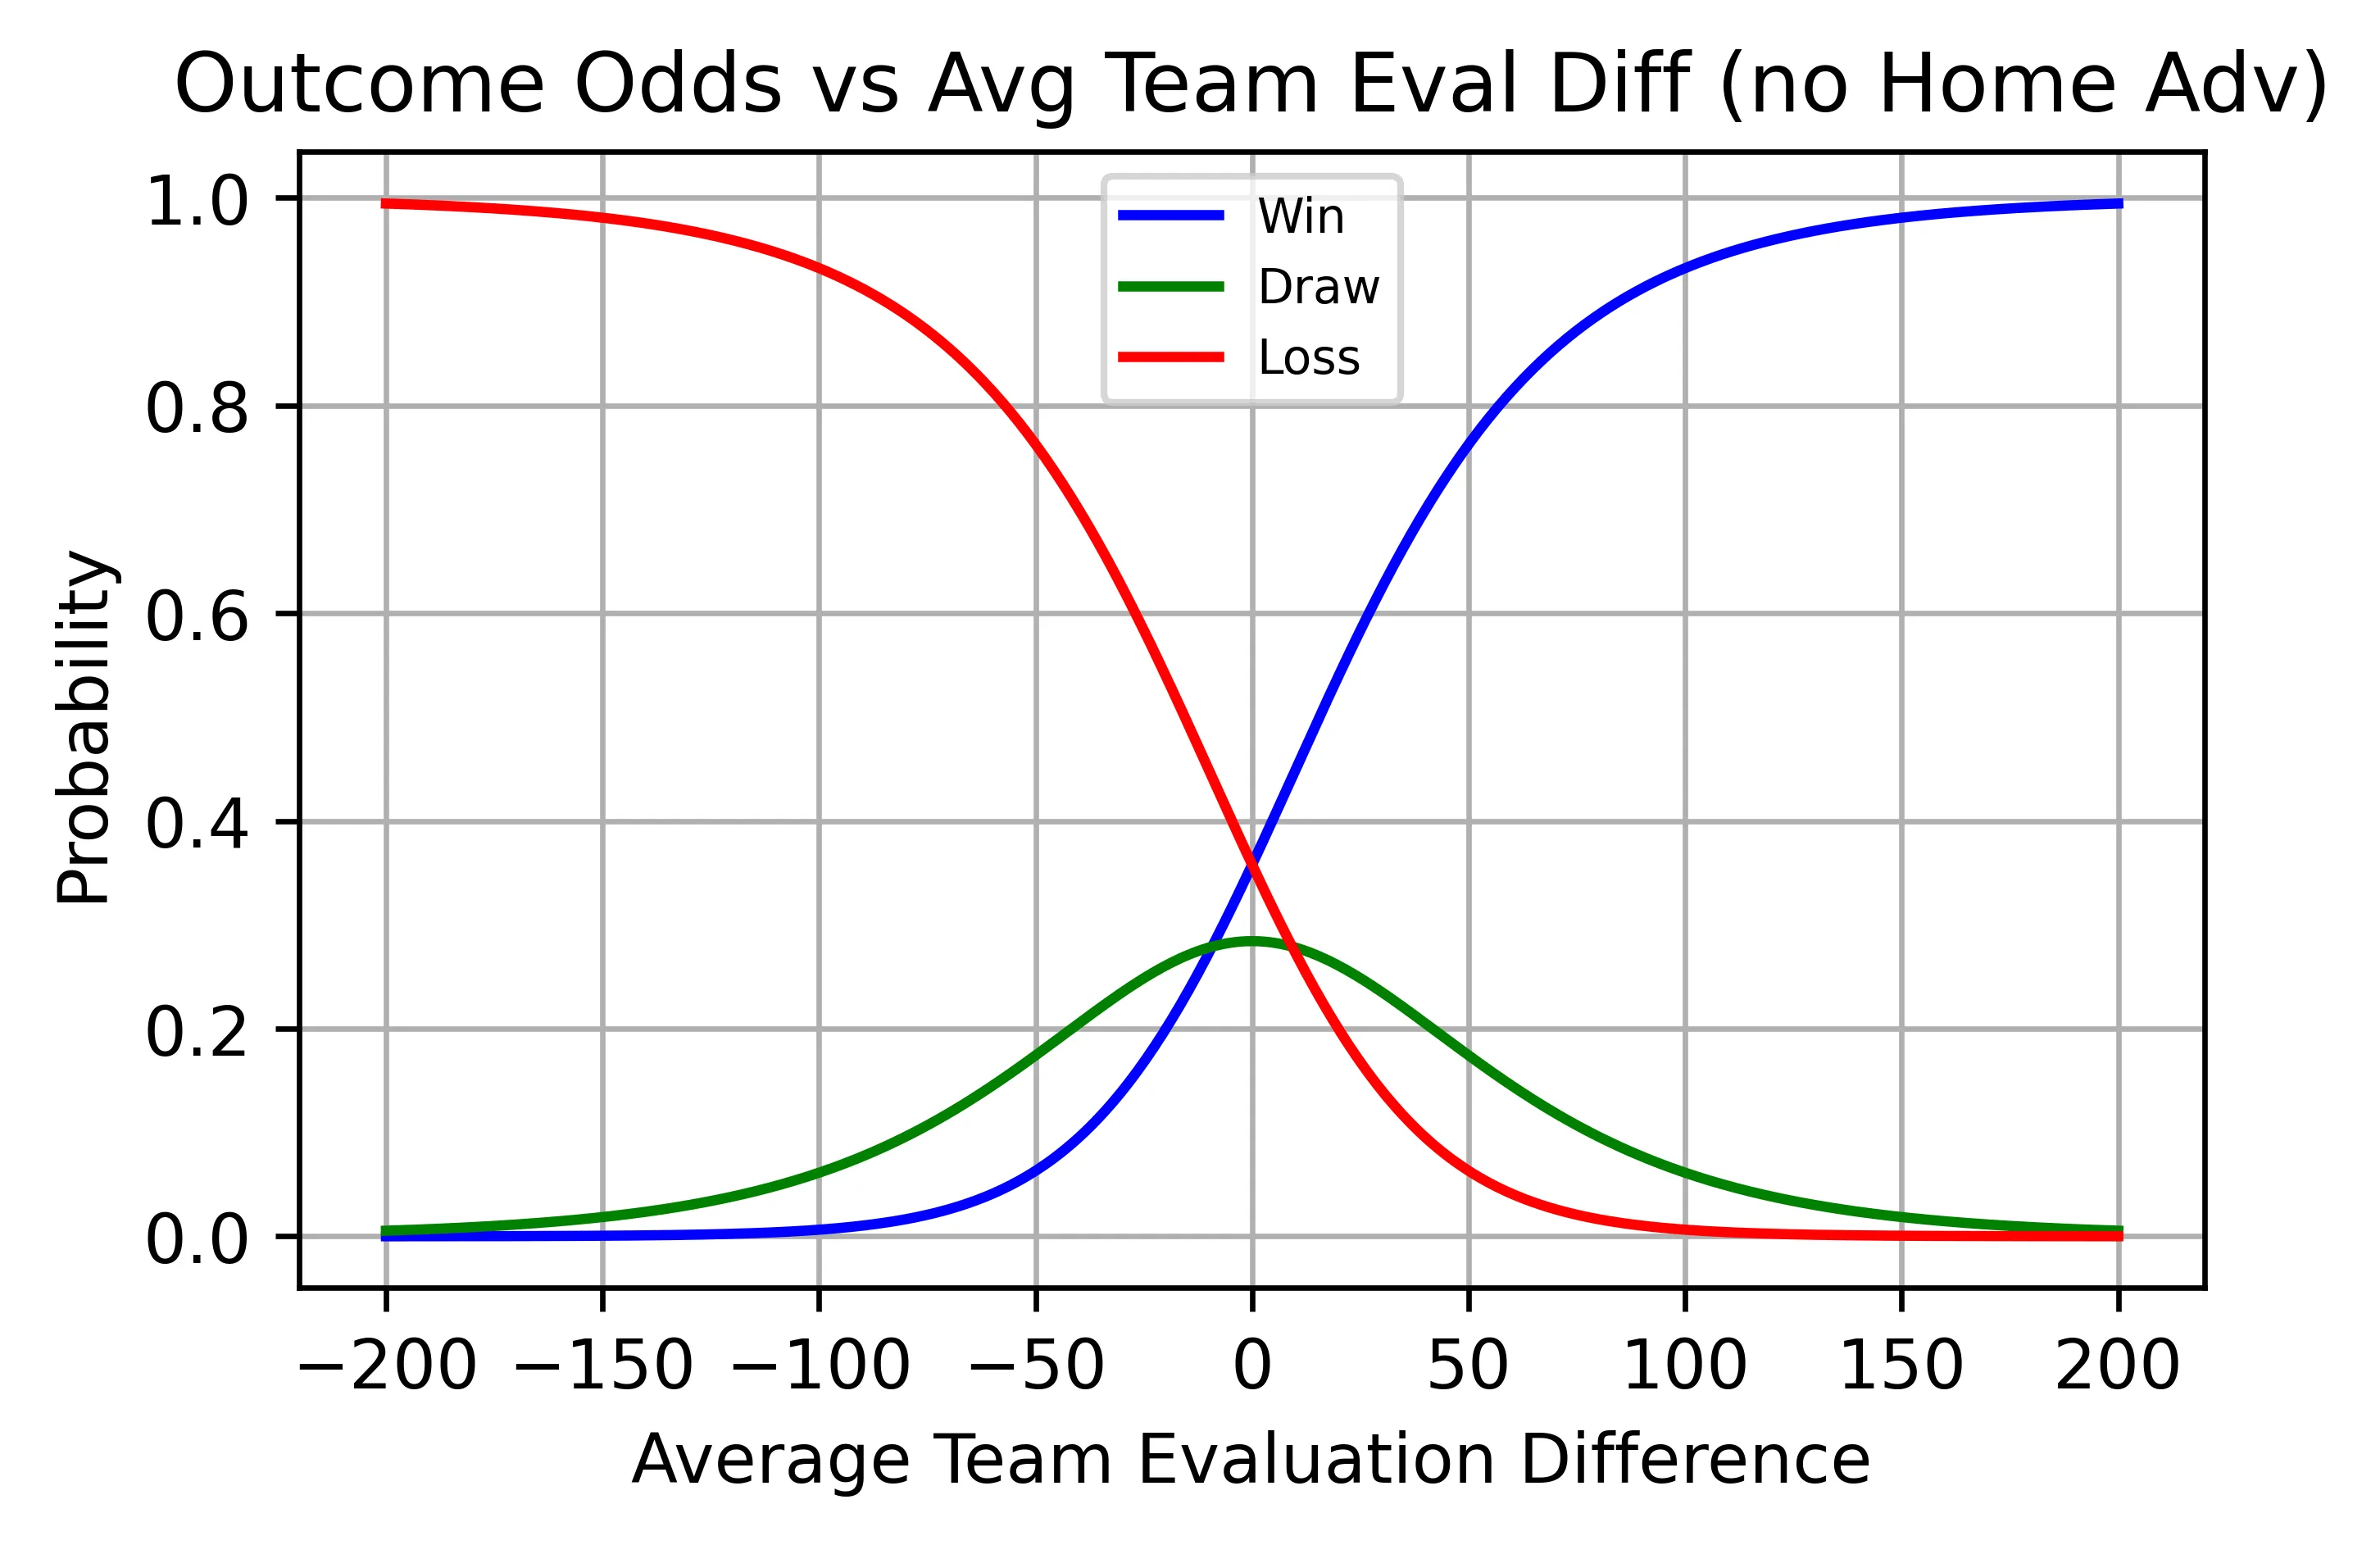
Next, this dataset is used to fit two formulas—one for goal differential and one for win/draw/loss odds—each based on average team Evals.
Home‐team advantage appears inherently in the data. To model a truly neutral venue, the best‐fit line is forced through the origin (0,0).
How can Rlvc be used to determine a player's market value?
A Rlvc of 50 represents the average player—who would command a negligible salary—while a Rlvc of 100 represents the top performer (strictly based on on-field contribution).
Therefore, once you set the top player’s salary, you can scale all other players’ salaries proportionally.
The mapping between these values and actual salary is subjective and could follow various trends—linear, shallow exponential, steep exponential, logarithmic, etc.
Why does the Penalties section only use shootout data?
Penalties that occur during normal game time are not included in the dataset for the penalties section. This is because those penalties are already used to calculate a player's normal Eval (either a goal was scored or not).
Furthermore, shootout penalties slightly differ from in-game penalties since the offense cannot favorably respond to any rebounds/deflections.